
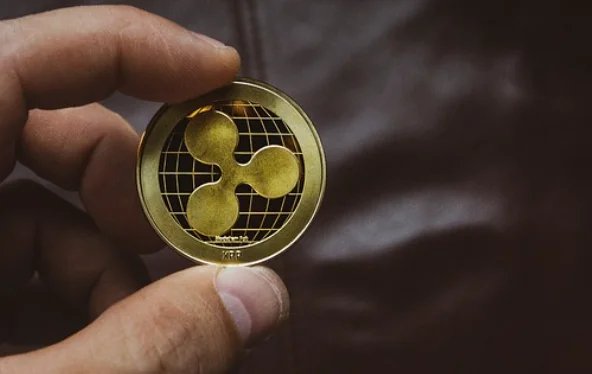
XRP’s Chart Mirrors the 2024 Setup That Preceded a 650% Surge
XRP is drawing renewed attention as its chart structure closely mirrors a formation seen in 2024, just before a sharp upward move. Analysts tracking the altcoin note that the current setup echoes the sequence that preceded that earlier 650% advance. As of Friday, September 4, 2026, XRP was trading near $2.15, having consolidated in a tight range over the past month—a pattern that technical analysts say resembles the pre-breakout phase from late 2024.
What the 2024 Pattern Shows: Key Levels and Momentum Signals
The 2024 rally, which began in November 2024 and extended into early 2025, saw XRP climb from roughly $0.50 to over $3.80—a gain of more than 650% over several weeks. That move was triggered by a breakout above a descending resistance line, accompanied by a surge in trading volume and a bullish crossover in the daily MACD indicator. Current charts show a similar descending wedge formation, with XRP compressing between support at $2.00 and resistance at $2.30. Volume has been declining during this consolidation, a sign that sellers are exhausting their momentum—a setup that often precedes a volatility expansion.
Why the Setup Could Repeat—and What Could Derail It
The repetition of this pattern is not coincidental, according to market analysts. In both instances, XRP was trading within a broader uptrend, supported by increasing institutional interest and positive regulatory developments. In 2024, the catalyst was the resolution of a long-running legal dispute with the U.S. Securities and Exchange Commission, which cleared uncertainty for investors. In 2026, similar optimism surrounds ongoing discussions about clearer crypto regulations in the U.S., though no final ruling has been made. However, a key difference is the macroeconomic environment: interest rates are higher now, and risk assets have faced headwinds from inflation concerns. If XRP fails to break above $2.30 with strong volume, the pattern could instead resolve downward, with support at $1.80 as the next critical level.
Market Context: XRP’s Position Relative to Bitcoin and Altcoin Sentiment
XRP’s potential breakout comes against a mixed crypto market. Bitcoin, the largest cryptocurrency, has been range-bound between $60,000 and $65,000 over the past week, showing no clear directional bias. Ethereum, the second-largest, has underperformed, down 5% in the last seven days. In contrast, XRP has held its ground, losing only 1% over the same period, which suggests relative strength. The total crypto market cap stands at $2.1 trillion, with altcoin dominance—excluding Bitcoin and Ethereum—at 18%, near its highest level since early 2025. This backdrop is favorable for altcoin rallies, as investors often rotate capital from large caps into mid-cap tokens like XRP when Bitcoin consolidates.
What to Watch: Volume and a Close Above $2.30 to Confirm the Rally
For the 650% rally thesis to play out, traders should watch for a daily close above $2.30 on above-average volume. A volume spike of at least 50% above the 20-day average would signal strong conviction. The next resistance levels are $2.80 and $3.50, which correspond to the 2024 breakout targets. Conversely, a drop below $2.00 would invalidate the pattern, potentially leading to a retest of $1.80. The key date to monitor is the upcoming Federal Reserve policy meeting on September 16, 2026, as any surprise rate hike could dampen risk appetite and derail altcoin rallies. Until then, the pattern remains intact, but confirmation is pending.








Comments are closed.