
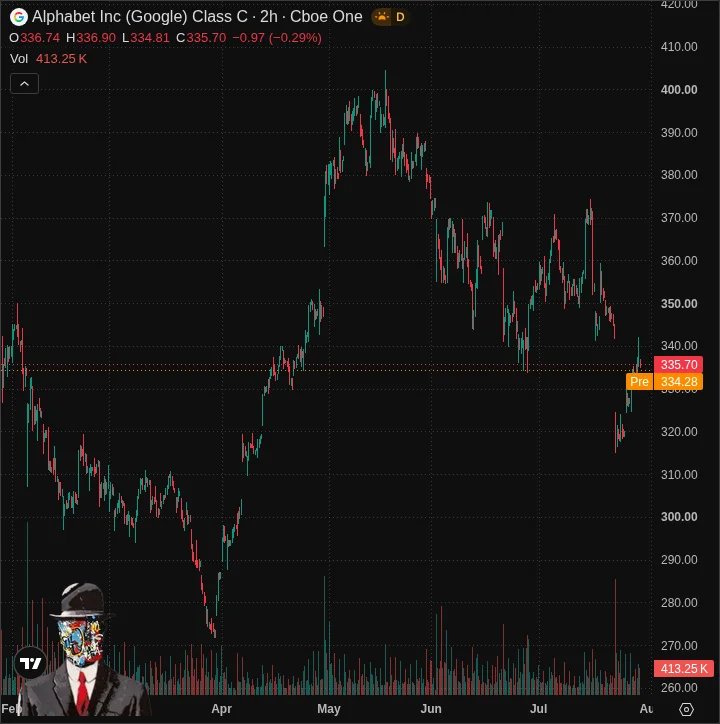
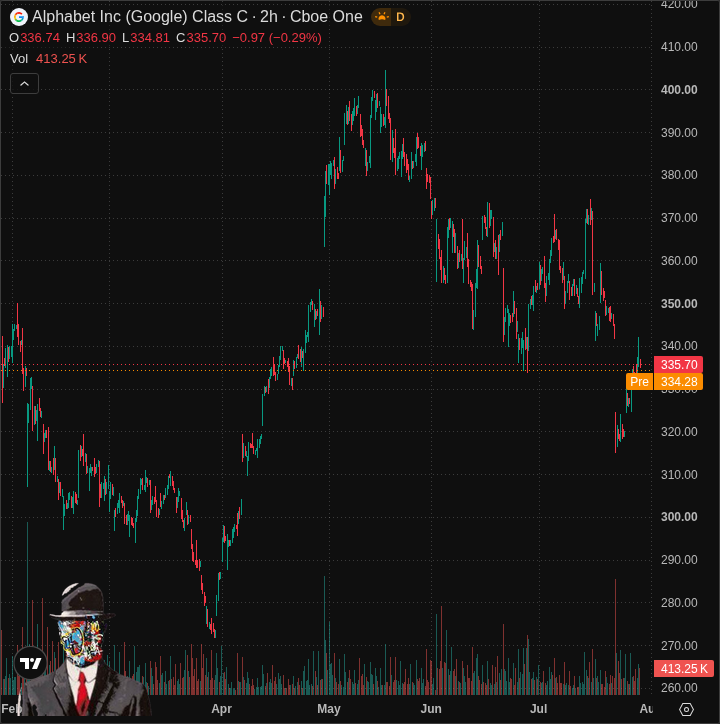
Alphabet Inc. (GOOG) is trading at $335.76, up 0.95% on the day, and the technical picture reads bearish.
On valuation, the stock carries a trailing P/E of 16.9, a market capitalisation of $4.11T, a dividend yield of 0.26%.
It sits around 68% of its 52-week range of $188.70 to $404.47. Recent price action screens support near $318.34 and resistance near $399.04.
On trend, the price is below its 20-day average of $348.13, and the 50-day average is at $358.46.
Momentum: the stock has returned -4.4% over the past month.
Key data
| Price | $335.76 |
| Day change | 0.95% |
| Trend | Bearish |
| Market cap | $4.11T |
| P/E (TTM) | 16.9 |
| EPS (TTM) | 20.15 |
| Dividend yield | 0.26% |
| 52-week range | $188.70 – $404.47 |
| SMA 20 | $348.13 |
| SMA 50 | $358.46 |
| 1-month return | -4.42% |
What the setup says
- Last price $335.76, day change 0.95%.
- Price is below the 20-day average ($348.13) with the 50-day average at $358.46.
- Shares sit around 68% of their 52-week range.
- Recent support/resistance screen: $318.34 to $399.04.
- Trailing P/E is 16.9; compare that against growth and margin direction before publishing a valuation call.
Automated market snapshot for information only; not investment advice.











Comments are closed.