

$BTC
#BitcoinPrice #CryptoMarket #TechnicalAnalysis #TradingSignals #BTCUSD #Cryptocurrency #CryptoTrading #FinancialMarkets #Investment #EconomicTrends #MarketAnalysis
Will Bitcoin Overcome Its Major Recovery Hurdles? Discover What’s Stopping Its Rise!
In the ever-evolving landscape of cryptocurrency, Bitcoin is currently facing a significant test. After a decline that saw it touch the lows of $112,400, there’s a palpable tension surrounding its potential recovery. As we delve deeper into recent bitcoin news, it’s evident that several technical and market factors are playing a pivotal role in shaping its trajectory.
Bitcoin’s Rocky Path to Recovery
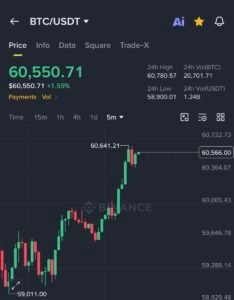
Bitcoin’s recent price movements paint a picture of uncertainty. After slipping below the crucial $115,500 mark, Bitcoin gathered bearish momentum, subsequently dropping below $113,500. This downturn was marked by a dip below the 100 hourly Simple Moving Average (SMA), a critical indicator used by traders to gauge market trends.
Despite these challenges, Bitcoin initiated a recovery wave, breaching the $113,500 zone briefly. However, resistance near $114,800 has proven to be a formidable barrier. This level aligns with a key bearish trend line on the hourly BTC/USD chart, sourced from Kraken. For enthusiasts and investors, the immediate question is whether Bitcoin can sustain this momentum and clear the $115,000 resistance zone, which could pave the way for further gains.
Key Resistance Levels and Market Sentiments
Looking ahead, Bitcoin faces immediate resistance at $114,800. Overcoming this could test subsequent resistance levels at $115,000 and $115,500. A break above these could potentially push the price towards $118,400, close to the 50% Fibonacci retracement level of the recent drop from $124,420 to $112,400. Achieving this could set Bitcoin on a path toward the $120,000 mark, with an eye on the $121,500 target.
Conversely, failure to breach the $115,000 resistance could lead to a renewed decline. Immediate support is found near $113,500, with more substantial support at $112,400. Should these levels fail to hold, Bitcoin could see further declines, potentially reaching down to $110,000 in the near term. The critical support rests at $108,000, below which the market could witness significant bearish momentum.
Technical Indicators and Future Projections
The Hourly MACD for BTC/USD is showing a slowdown in bearish intensity, suggesting a possible shift in momentum. Additionally, the Relative Strength Index (RSI) is now above the 50 mark, indicating a neutral to slightly bullish sentiment among traders.
For potential investors and market watchers, these indicators serve as crucial tools. Understanding their implications can provide insights into possible future movements of Bitcoin’s price.
Explore More About Bitcoin’s Market Dynamics
For those keen on further insights and detailed analysis of Bitcoin and other cryptocurrencies, consider exploring more through various resources. Engage with comprehensive market analyses and expert opinions to better understand the intricate dynamics of the crypto market. Visit Binance for detailed trading options and crypto exchange services.
Conclusion: A Test of Resilience and Market Sentiments
Bitcoin’s journey is emblematic of the broader cryptocurrency market’s volatility. As it attempts to climb back, the interplay of resistance levels, investor sentiment, and technical indicators will dictate its path forward. Monitoring these elements closely will provide investors and observers with the necessary insights to navigate this complex market.


Comments are closed.