

$BTC $ETH
#Bitcoin #Crypto #Cryptocurrency #Blockchain #HODL #Trading #Investing #Finance #BTC #MarketAnalysis
On-chain indicators are crucial tools for analyzing cryptocurrency market trends, and one such metric, the Bitcoin Binary Coin Days Destroyed (CDD), offers insightful predictions about the movement of Bitcoin’s price. The concept of Coin Days Destroyed has gained traction among investors as it highlights the level of activity among long-term holders, potentially signaling major market moves. A coin day accumulates for each day a coin remains unspent on the blockchain. When these dormant coins suddenly move, the accumulated ‘coin days’ are ‘destroyed’, resetting to zero. This event is significant as it reflects a change in the behavior of long-term investors, who typically move their holdings with a strategic purpose in mind.
Recently, there has been a particular focus on the Binary version of the CDD. The Binary CDD contrasts current HODLer transactions against historical averages, turning into a binary outcome—either depicting a state of relative inactivity (0) or signaling increased activity (1). It’s especially noteworthy when there’s a deviation from the norm, as this may suggest a shift in investor sentiment or behavior. The Binary CDD is adjusted for Bitcoin’s total circulating supply, acknowledging that the asset’s supply increases over time. Current trends show the 30-day Moving Average (MA) of the Binary CDD indicating an upward trajectory. This subtle yet significant movement hints at long-term holders becoming increasingly active—a phenomenon often preceding market rallies.
The current observation places the 30-day MA of the Bitcoin Binary CDD around 0.60. This level has not reached the peaks seen during past bull runs, such as those in the last year or the 2021 euphoria phase, where it breached the 0.80 mark. This suggests that, despite the recent uptick in activity, there might still be room for growth in the current Bitcoin rally from a HODLer distribution perspective. It’s indicative of a market where longstanding investors are starting to move their holdings, possibly taking profits or reallocating investments in anticipation of future price movements.
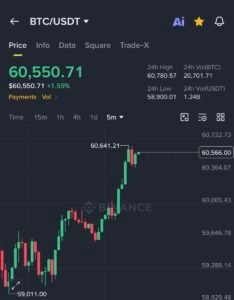
Bitcoin’s price itself has responded positively to these underlying dynamics, with a notable increase to around $102,300, marking a 3% rise over the last week. Such price movements underscore the interconnectedness of on-chain indicators like the Binary CDD with broader market trends. Investors closely watching these metrics might gain early insights into potential shifts in market dynamics, offering a strategic advantage in managing their portfolios. As the crypto market continues to mature, the relevance and utility of sophisticated on-chain metrics like the Binary CDD will only increase, providing nuanced layers of analysis beyond traditional price and volume data.


Comments are closed.